
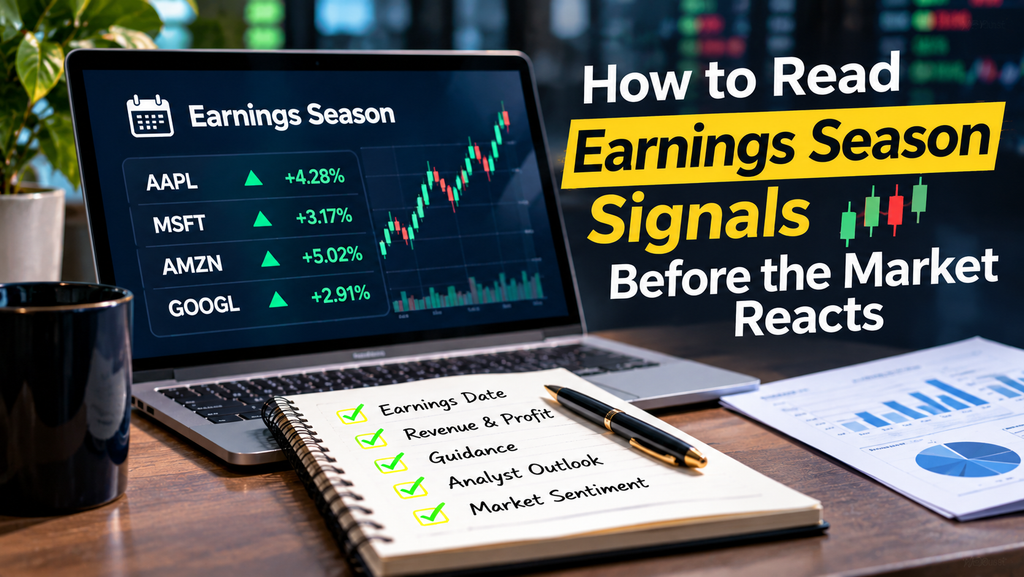
In brief: Stock prices react to earnings relative to expectations, not to absolute results. The signals that matter most are forward guidance, revenue growth and quality, margin trends, cash flow, management commentary and the market’s positioning going into the report. Reading these together, rather than focusing on whether earnings per share “beat” a single estimate, helps investors understand why stocks move and whether a company’s long-term story is strengthening or weakening.
Four times a year, markets enter earnings season. Thousands of listed companies report quarterly results within a few weeks, and share prices can swing sharply in minutes. Headlines often reduce the story to one line: “beat” or “miss.” But experienced investors know that a company can beat estimates and see its stock fall, or miss and watch it rally.
The reason is that markets are forward-looking and expectation-driven. To read earnings well, you need to look past the headline numbers to the signals underneath. This guide breaks down the most important signals, what bullish and bearish versions look like, and how to build a simple routine for earnings season.
Why Expectations Matter More Than Results
Before a company reports, analysts publish estimates for revenue, profit and earnings per share (EPS). These estimates, along with informal investor expectations sometimes called the “whisper number,” are already reflected in the share price. When results arrive, the market compares them with what was expected and, more importantly, with what the results imply about the future.
So a strong quarter that was widely anticipated may produce little reaction, while a modest quarter accompanied by improved guidance can lift a stock. Understanding this dynamic is the foundation for reading earnings signals.
The Key Signals, Card by Card
1. Forward Guidance
Many companies provide forecasts for the next quarter or full year. Because markets look ahead, guidance is often the single biggest driver of the post-earnings move.
2. Revenue Growth and Quality
Profit can be managed through cost cuts or accounting choices, but revenue reflects real demand. Look at the growth rate and where it comes from.
3. Margin Trends
Gross and operating margins reveal pricing power and cost control. The direction of margins over several quarters is more informative than a single figure.
4. Earnings Quality
Not all profit is equal. One-off gains, tax benefits or asset sales can inflate headline earnings.
5. Cash Flow
Cash is harder to manipulate than accounting profit. Operating and free cash flow show whether profit turns into real money.
6. Balance Sheet Movements
Changes in inventory, receivables and debt can foreshadow future problems or strength.
7. Management Tone and the Earnings Call
The conference call often matters as much as the press release. Analysts’ questions highlight what investors are worried about.
8. Segment and Geographic Detail
Breaking results down by product line or region reveals where growth and weakness really sit.
9. Capital Allocation
How a company uses its cash signals management’s confidence and priorities.
10. Market Positioning Before the Report
If a stock has rallied strongly into earnings, expectations are high and the bar is raised. If it has been heavily sold, even modest results can spark a relief rally.
Reading Signals Across a Sector
Earnings season is also a window into the wider economy. The first major companies to report in a sector often set the tone for peers. A large bank describing loan growth and credit quality, a leading IT services company commenting on client budgets, or a consumer goods giant discussing rural and urban demand can shift expectations for the whole industry. Watching these “bellwether” reports helps investors anticipate what smaller companies may report later.
A Worked Example: Beat and Fall
Imagine a consumer company reports quarterly EPS ahead of the consensus estimate. Headlines say “profit beats expectations,” yet the stock drops sharply. Digging into the signals explains why. Revenue grew more slowly than the previous quarter, and almost all of it came from price increases rather than higher volumes, suggesting demand is weakening. Gross margin fell because of higher input costs. The profit beat came largely from a lower tax rate and a one-time gain on an asset sale. Inventory rose much faster than sales. And on the call, management lowered its full-year revenue guidance and described rural demand as “uneven.” Scored on the five core signals, this quarter comes out clearly negative despite the headline beat, which is exactly what the market priced in.
The reverse also happens. A company can miss EPS estimates because it is investing heavily in a promising new product, while revenue accelerates, cash flow stays strong and guidance rises. In that case, a stock may rise despite the “miss.”
Where to Find the Information
- Press release and investor presentation: published on the company’s investor relations page and stock exchange filings.
- Regulatory filings: detailed financial statements and notes, including segment data and risk factors.
- Earnings call: webcast live and usually followed by a transcript or recording.
- Analyst estimates: available on financial data platforms and broker research.
An Earnings-Day Timeline
| When | What to do |
|---|---|
| One week before | Note consensus estimates, previous guidance and key questions from the last call. |
| Day before | Check how much the stock has moved recently and what options markets imply about the expected move. |
| Release time | Read the press release: revenue, margins, EPS, guidance and any one-off items. |
| First hour | Review the investor presentation and segment details; compare with expectations. |
| Earnings call | Listen for guidance changes, demand commentary and tone in the Q&A. |
| Following days | Read the full filing, check cash flow and balance sheet, and update your investment thesis. |
A Simple Scoring Framework
To avoid being swayed by headlines, give each of five core signals a score of +1 (positive), 0 (neutral) or −1 (negative): guidance, revenue quality, margins, cash flow and management commentary. A total of +3 or more suggests the business is strengthening; −3 or less suggests deterioration. This does not predict short-term price moves, but it helps long-term investors decide whether their reason for owning a stock still holds. Tracking the score over several quarters is even more useful, because a steady trend says more than any single report.
Common Mistakes Investors Make
- Reacting only to EPS beat or miss headlines.
- Ignoring guidance and management commentary.
- Comparing adjusted figures without checking what was excluded.
- Overlooking cash flow and working capital changes.
- Trading on the first price move, which can reverse within hours or days.
- Forgetting the broader context, such as interest rates, sector trends and currency effects.
Earnings Glossary
- EPS (Earnings per share)
- Net profit divided by the number of shares outstanding.
- Consensus estimate
- The average forecast of analysts covering the company.
- Guidance
- Management’s own forecast for future revenue, profit or other metrics.
- Operating margin
- Operating profit as a percentage of revenue, showing core profitability.
- Free cash flow
- Operating cash flow minus capital expenditure; cash available to shareholders.
- Operating leverage
- When profits grow faster than revenue because fixed costs are spread over more sales.
- One-off items
- Unusual gains or charges that are not expected to recur.
- Whisper number
- The unofficial expectation among investors, which may differ from consensus.
Key Takeaways
- Markets react to results versus expectations, and especially to the outlook.
- Guidance, revenue quality, margins and cash flow matter more than the EPS headline.
- The earnings call often reveals more than the press release.
- Pre-earnings positioning sets the bar a company must clear.
- Use a consistent framework to judge whether your investment thesis still holds.
This article is for educational purposes only and is not investment advice. Investing in stocks involves risk, including loss of capital. Consult a registered investment adviser before making investment decisions.
Frequently Asked Questions
What is earnings season?
Earnings season is the period after each quarter ends when most listed companies publish their quarterly financial results. In the US and India, the heaviest reporting usually falls in the few weeks following the end of March, June, September and December.
Why do stocks fall even when earnings beat estimates?
Prices reflect expectations. A stock can fall after beating estimates if guidance disappoints, margins weaken, the beat came from one-off items, revenue quality is poor, or investors had expected an even bigger beat than analysts forecast.
What is the most important number in an earnings report?
There is no single number, but forward guidance often moves stocks the most because markets look ahead. Revenue growth, operating margin and free cash flow are also key indicators of business health.
What should I listen for on an earnings call?
Listen for changes in guidance, comments on demand trends, pricing power, costs, order books and capital allocation, plus management’s tone and how directly they answer analysts’ tougher questions.
Is it a good idea to trade around earnings announcements?
Trading around earnings is risky because prices can gap sharply in either direction. Long-term investors often use earnings reports to check whether a company’s business thesis remains intact rather than to make short-term bets.